The home is the landing page for all controllers, in the Home Configuration you control what content and what widgets your Home will contain.
On the Home screen click the cog wheel icon to see the settings for the Home screen.
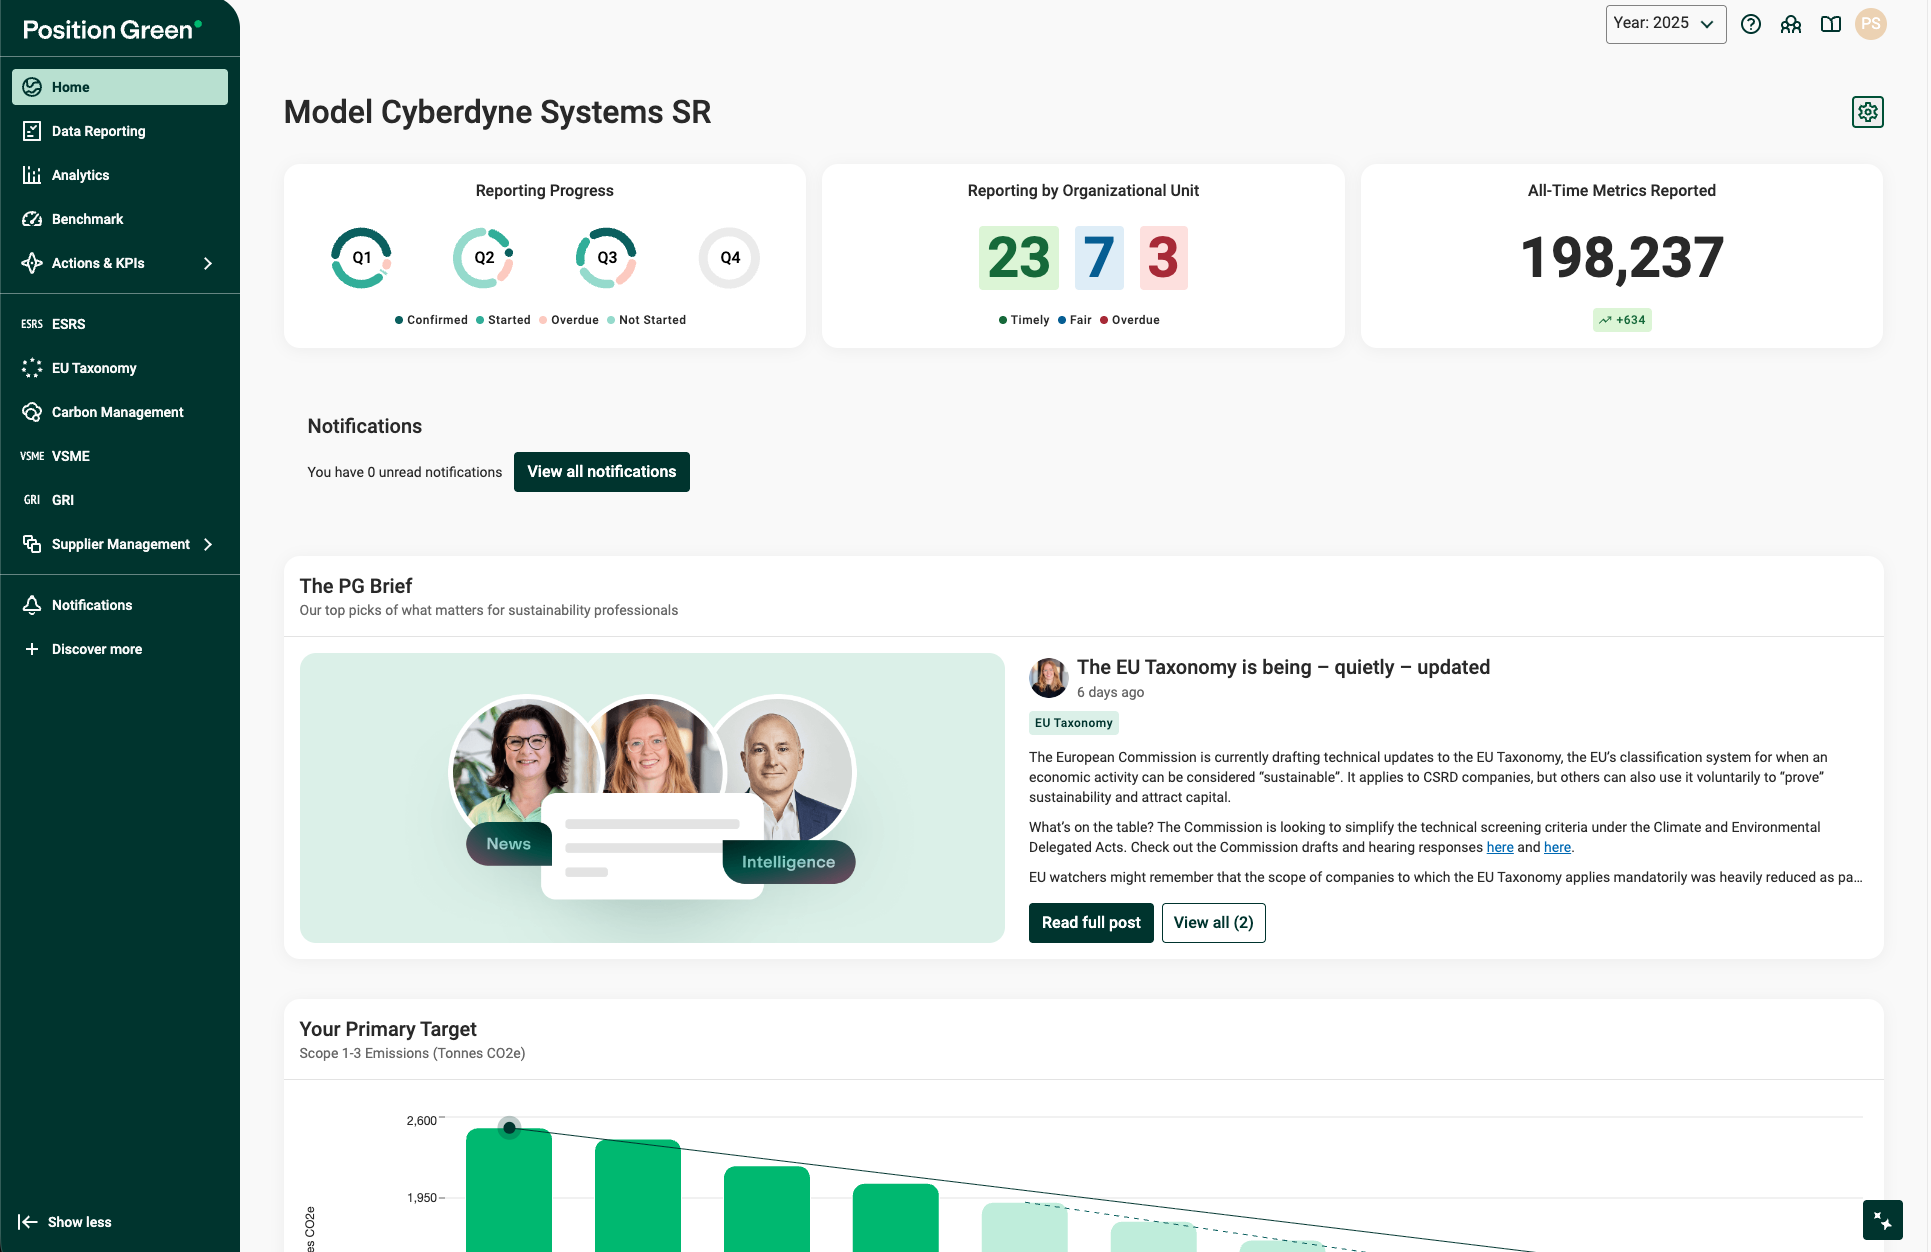
Display of widgets in the home page.
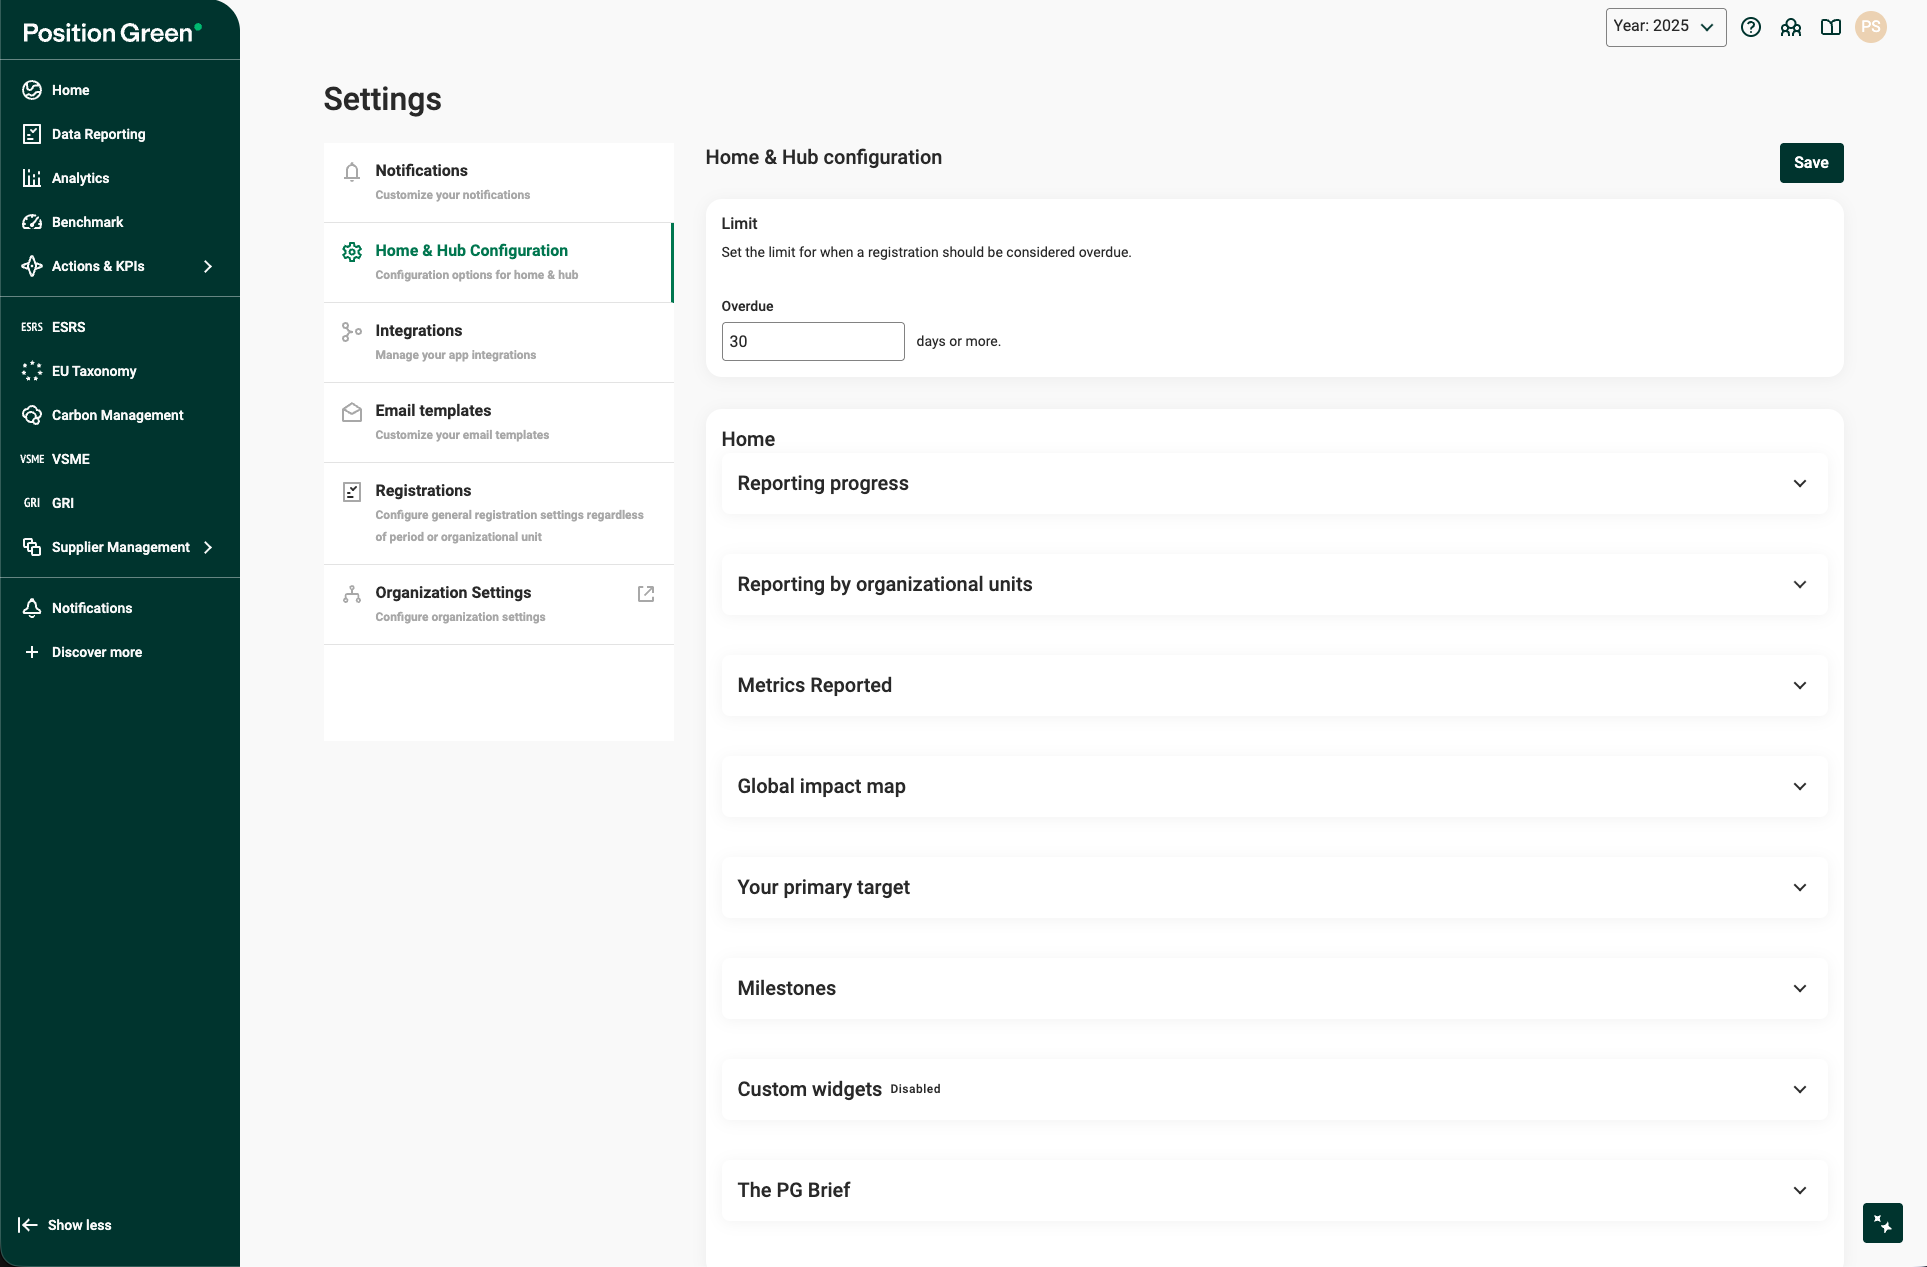
Configuring Your Home and Carbon Management Hub
The Home & Hub configuration page allows administrators to customize the visibility and data parameters of the main dashboard (Home) and the Carbon Management Hub. This guide walks through the available settings to ensure your data is displayed accurately and meaningfully.
1. Global Overdue Limits
At the top of the configuration page, you can define the global threshold for registrations.
- Overdue: Enter the number of days after which a registration should be flagged as overdue (e.g., 30 days).
2. Home Dashboard Widgets
The Home section allows you to toggle which widgets appear on your main dashboard and configure their specific data sources.
Reporting Progress
- Add to Home: Check this to see a high-level view of current reporting completion.
- Reporting by organizational units: Define the "health" of your reporting cycles. You can set day ranges for Timely, Fair, and Overdue responses relative to the end of a reporting period.
Metrics and Maps
- Metrics Reported: Enable this to display a summary of reported data points.
- Global Impact Map:
- Tags: Select up to 5 tags to aggregate on the map. Ensure all tags use the same unit.
- Unit & Description: Select the appropriate unit (e.g., tonnes CO2e) and provide a brief label for the map.
Targets and Milestones
- Your Primary Target:
- Configuration: Select tags, units, and a start year.
- Forecast: Toggle Show forecast to project future trends.
- Target Values: Define your Base year, Target year, and the specific Value your organization is aiming for.
- Milestones: Use the Add milestone button to list key dates, titles, and links that will appear in a dedicated widget.
3. Custom Widgets
If you need to display specific external links or unique data sets, use the Custom widgets section.
- Widget Types:
- Shortcut: Creates a quick-link button with a custom title and subtitle.
- Bar Chart: Displays an aggregated sum of up to 5 selected tags for the active year.
- Display Options: For bar charts, you can choose to Show legend and Show Y-axis to improve readability.
4. Carbon Management Hub
This section controls the specific KPIs visible within the specialized Carbon Management Hub. You can toggle the following on or off using the Add to Hub checkboxes:
- Emissions per unit of revenue: Tracks carbon intensity against financial performance.
- Emissions per employee: Tracks carbon intensity relative to workforce size.
- Data quality: Displays the reliability and source-type of your carbon data.
- Methods for Scope 3: Displays the calculation methodologies used for indirect emissions.
5. The PG Brief
Enable this widget to receive early insights into emerging sustainability developments and regulatory changes. This is a curated informational feed to help your organization stay prepared for future reporting requirements.
? Pro-Tip: Always click the Save button in the top right corner after making changes. If a widget isn't appearing as expected, ensure the Add to Home or Add to Hub checkbox is strictly checked within that specific section.
Was this article helpful?
That’s Great!
Thank you for your feedback
Sorry! We couldn't be helpful
Thank you for your feedback
Feedback sent
We appreciate your effort and will try to fix the article