Get started with Carbon Accounting
Purpose of this guide
Position Green Carbon Management accelerates the journey from data collection to decarbonization, turning carbon data into strategically relevant insights, not just a compliance checkbox.
Use this guide for a step-by-step overview of how to get started and use the product effectively.
Set up the organization
Why this step is important
This step ensures that emissions can be calculated, reviewed, and reported in the right way. Make sure the platform reflects how the organization is managed, how reporting should work, and how data is consolidated in the inventory.
What to do in this step
Define:
- Basic settings: language, currency, units, number formats, and materiality threshold
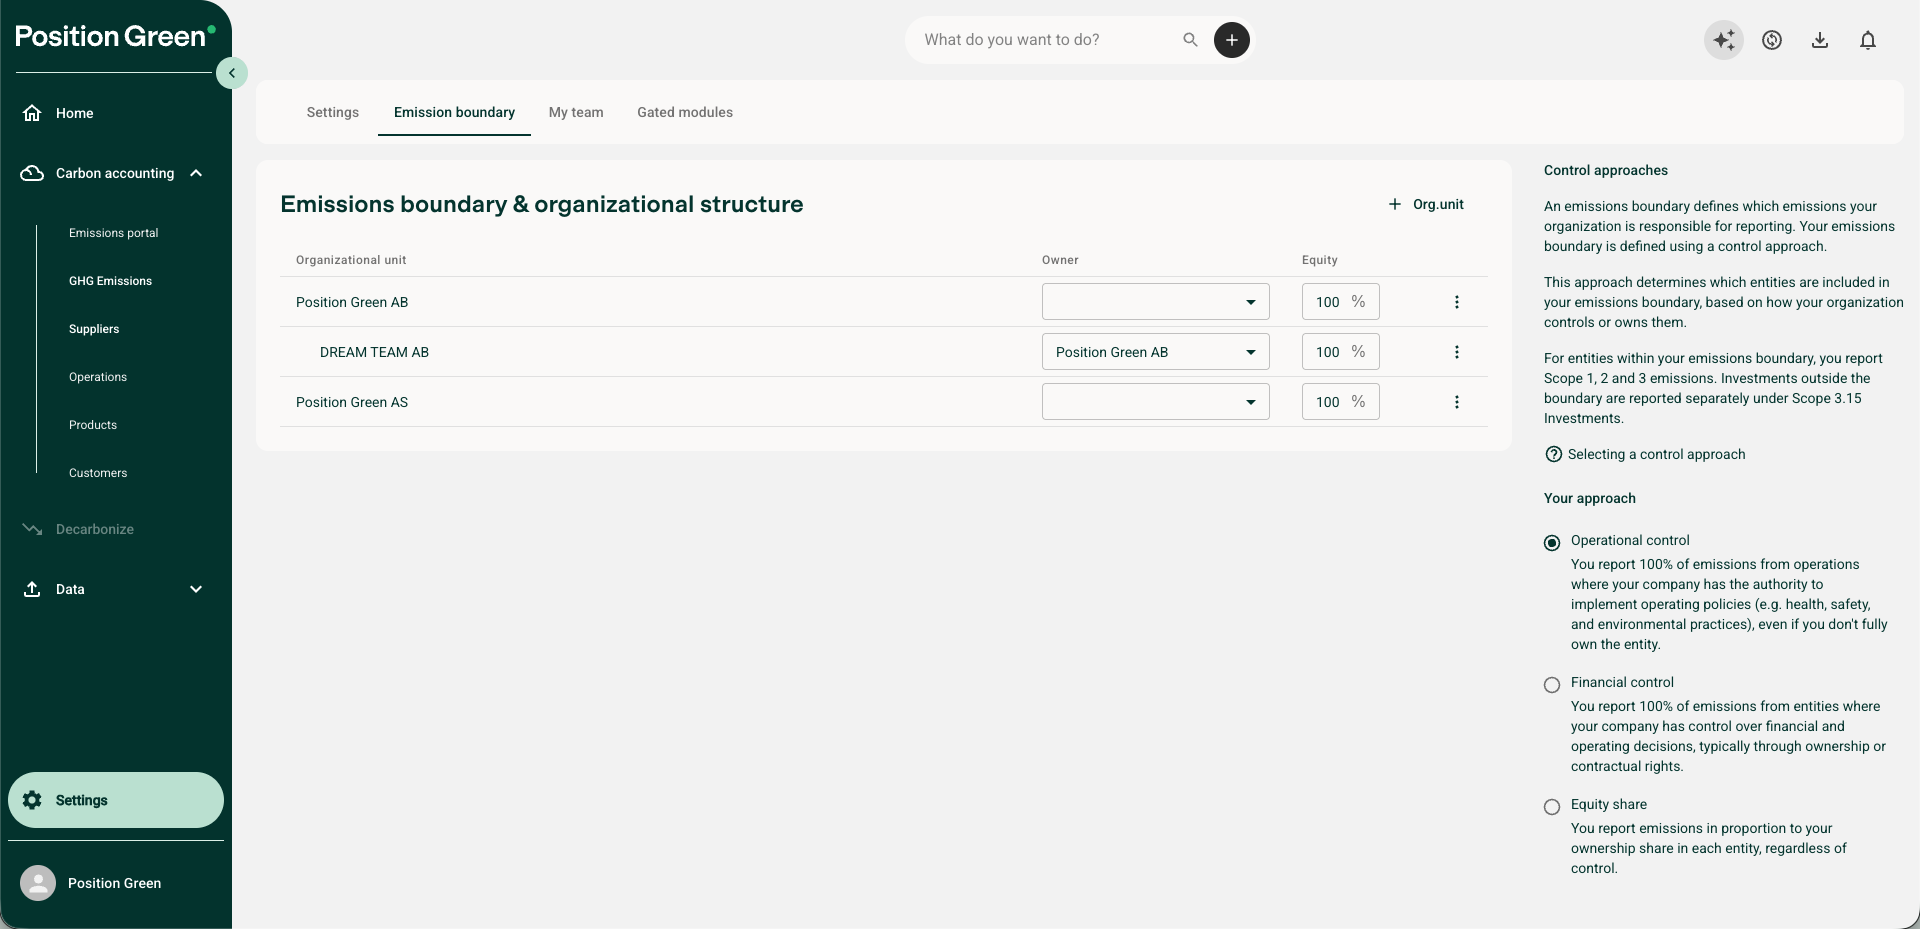
- Organizational structure: legal entities, org.units, sites, or locations
- Emission boundaries and consolidation approach
- Users, roles, and access
How to do it
Go to Settings in the bottom-left corner. Do this first when entering the product for the first time.
How this is maintained over time
Change basic settings and user roles when needed.
When the organizational structure changes, the complete historical inventory changes accordingly. Historical data is not lost. Position Green keeps detailed change logs so changes can be reverted if needed. Read more about this in the emission boundary article.
Add data sources
Once the structure and boundaries are defined, start adding data.
Why this step is important
Position Green Carbon Management handles large amounts of data from different data sources. This is the customer data ecosystem. Connecting or adding data from this ecosystem determines how the carbon footprint is managed.
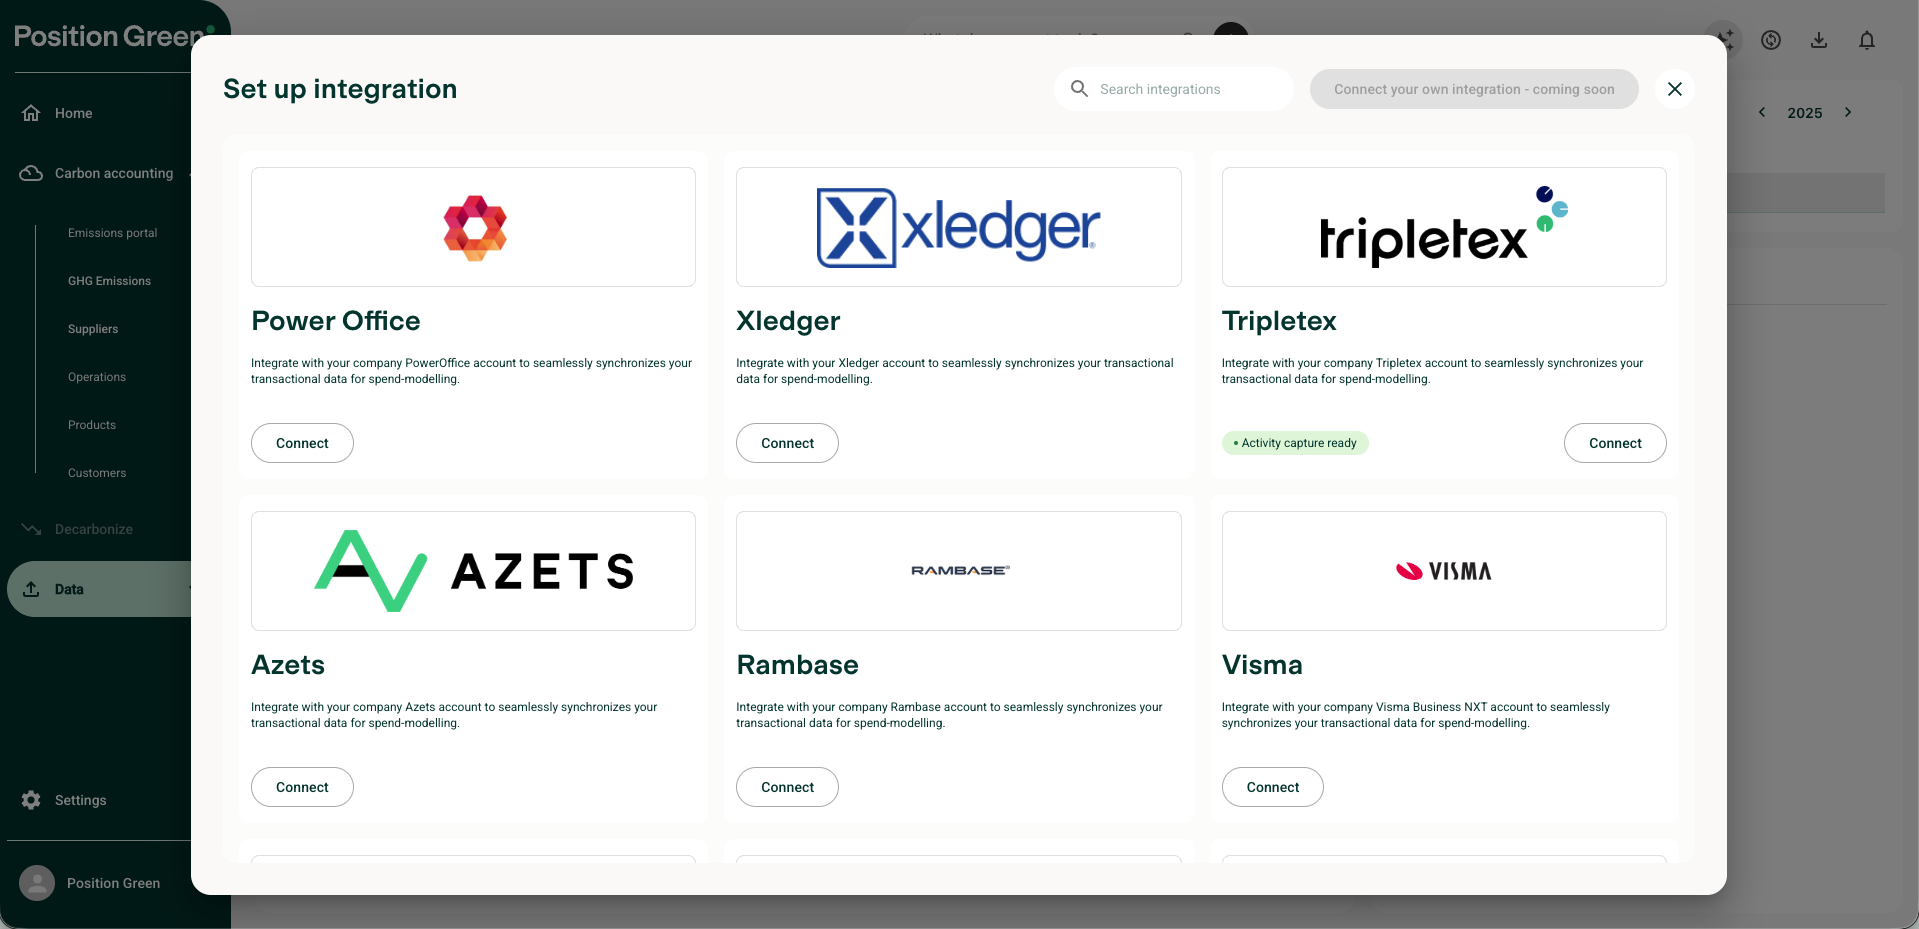
For the best experience, bring the data as close as possible by sending data to the platform through the Position Green API or by integrating systems.
The goal is to collect the best available data while making gaps and assumptions visible.
What to do in this step
Start by getting an overview of the internal data ecosystem. Ask questions such as:
- Where does the activity data come from?
- Where do invoices live?
- Which ERP systems are used?
Then decide which data sources to include and how to include them. Send data to the API, integrate systems, upload files, or add manual inputs. Combine several data sources and ingestion approaches to build a complete emissions inventory.
Examples of data sources include invoices, ERP or finance systems, utility systems, Excel files, PDF documents, and supplier data.
How to do it
Open Data in the left navigation menu. In Data, choose between:
- Setting up an integration an integration
- Set up one of the off-the-shelf integrations.
- Integrate with the platform using the API documentation.
- Contact Position Green to set up an integration outside the standard offering. Additional costs may apply based on the scope of work.
- Uploading data manually
- Excel files with financial data
- Excel files with activity data (coming soon)
- PDF invoices through Activity Capture
The most common integrations are financial accounting from an ERP system and operational data from an energy management system. To set up an integration, follow the integration guidance.
Account settings
Especially for ERP integrations and financial data uploads, not all data is relevant or generates emissions. Examples include tax, inter-company transactions, and accounted periodization. Position Green uses financial account codes to exclude, include, and place data in the right Scope category, together with the context of the payment, supplier, and invoice line. Read more about account settings.
How this is maintained over time
If an integration is set up, data flows from the connected system to Position Green at the defined interval, such as once per month after financial accounting has closed. In Data, under Integrations, monitor incoming data by checking the sync log, error messages, and the last time data came in.
If data is uploaded, review the upload log and error messages if something goes wrong.
Note that you can also use Position Green without integrations or file uploads, with only manual data entries. In that case, jump directly to "Add data manually"
Validate and reconcile data
After data has been uploaded or connected, we suggest you review the data before finalizing calculations.
Why this step is important
Most ingested data has already gone through some verification process, such as financial accounting or invoice approval. Still, reconciliation is important to verify that all data has been received and handled correctly. Usually, the first data import requires some work, but each validation decision is saved and applied automatically the next time data is ingested.
Use this step to ensure the integrity of the data used for the inventory, make the inventory easier to audit, and reduce workload over time.
The goal is not perfect data from day one. The goal is to understand the quality of the data and improve it over time.
What to do in this step
Carbon Management is designed to identify areas that need attention so data quality can be improved before reporting. Each time data enters the platform, the system shows where validation is needed. Validation jobs are also visible in dashboards.
Validating data involves automated workflows including, but not limited to:
- Missing data
- Duplicates
- Unusual values
- Low-confidence matches
- Incorrect categories
- Data that needs additional evidence
- Data that should be excluded from the inventory
How to do it
Data validation happens at the point of data ingestion in Data. Validation jobs can also be accessed through dashboards. Most validation work appears as a list where the user is asked to verify whether the data looks correct, adjust it if needed, and approve it when done.
Read more about reconciliation and review of integrations and data uploads here.
For validation of data through Activity Capture, read more here.
How this is maintained over time
The Carbon Management data model remembers user actions, so adjustments to data categorizations are remembered. This reduces the data validation process over time.
Work with data in different views
Once data is ingested and validated, emissions have already been calculated and the first draft of the GHG inventory is ready. Go to Carbon accounting to see how the data has been organized, explore hotspots, and identify where data quality needs improvement.
In GHG emissions, the inventory is divided into Scope 1, 2, and 3, in line with the GHG Protocol. In Supplier, the same data is organized per supplier. Additional views are coming soon.
Why this step is important
Use this step to see how the data looks in the inventory and plan next steps to optimize the inventory.
What to do in this step
Explore the different scopes and scope categories to understand how the data is organized. Note changes to make in the different views.
Use the standard dashboards to explore analytics such as:
- Largest emission sources
- Suppliers with high emissions
- Categories with poor data quality
- Areas where spend-based calculations are still used
- Activities with high reduction potential
- Parts of the inventory that need better evidence
Changes that can be made include:
- Manage emissions in scope categories
- Change emission factor
- Organize emissions in collections
- Collaborate by giving colleagues access and adding comments
Use these overviews to prioritize where to improve data and where to take action.
How this is maintained over time
All changes made to the inventory are remembered for future reference and the next data upload.
Create collections
In Position Green Carbon Management, emissions are organized in collections. A collection gathers emissions across scopes that relate to the same operational part of the business and have the same decarbonization potential.
For example, a collection can be called "Car fleet". Although the main emissions are associated with Scope 1.1 Mobile combustion, emissions from cars can span Scope 1, 2, and 3. This includes Scope 2 for electric vehicles and Scope 3 for upstream fuel production emissions. Creating a collection for these emissions shows the complete footprint of the car fleet and makes it possible to create actions that cover it.
Why this step is important
Collections are important for two reasons:
- Operational relevance: Collections make it possible to organize emissions in ways that reflect company operations, rather than only working in the GHG Protocol framework. Increased operational relevance supports collaboration with internal stakeholders and helps the company implement reduction measures related to operations rather than only to a scope category. This capability will be further improved with the Operations view.
- Decarbonization context: Collections provide better context on what emissions relate to. If "Diesel" is logged without context, the Decarbonization module does not know whether the diesel relates to a car, generator, or heavy-duty truck. Collections add context that is essential for high-quality decarbonization suggestions.
What to do in this step
In GHG emissions, review the data within each scope category and create cross-category collections. Each collection can have a name, description, labels, comments, and attachments.
In most cases, some collections are automatically generated. Review these collections and enrich them with more context.
How to do it
Select the emissions to include and click "Add to collection". Name the new collection, then continue adding emissions throughout the inventory.
The challenge is to create the right collections for specific needs.
How this is maintained over time
Many parts of this workflow are automated over time. Once new data is ingested and identified as identical or very similar to previous data, the new data is added to the same collections as the previous data.
Add data manually
If data was not ingested in Step 2, add that data manually. It is possible to skip Step 2 and only add data manually, but this creates a tedious data collection process and increases the risk of human error. Go through Step 2 first, then add data manually if needed.
Why this step is important
The data ecosystem likely contains most data needed for the GHG inventory, but some scope categories may not be represented. These are usually downstream Scope 3 categories, such as employee commuting. Add this data manually to ensure a complete inventory.
What to do in this step
Manually add the data needed to perform an activity-based emission calculation. This includes adding consumption, such as liters of fuel, kWh of electricity, or mass of material, and choosing an appropriate emission factor from the library.
How to do it
Add data manually by following these steps:
- Open an existing collection or create a new collection.
- Click "Add consumption".
- Add the consumption data, such as liters of fuel.
- Review the suggested emission factor by clicking "Details". Choose a different variant in Details if needed.
- Choose the period the consumption applies to, either a specific date range or a specific date.
- If relevant for Group users, specify the business unit.
Add labels, comments and attachments
Guidance coming soon.
Engage suppliers and improve data
Guidance coming soon.
Create reduction actions
Guidance coming soon.
Reporting and audit documentation
Guidance coming soon.
Good practice tips
- Start with the best data available. Improve data quality over time.
- Prioritize the areas that matter most. Focus first on large emission sources, important suppliers, and categories with poor data quality.
- Document assumptions. If data is estimated or incomplete, record this clearly.
- Use data quality as a management tool. Data quality is not only important for reporting; it helps decide where to improve.
- Move from measurement to action. The purpose of Carbon Management is not only to calculate emissions, but to help understand what to do next.
Was this article helpful?
That’s Great!
Thank you for your feedback
Sorry! We couldn't be helpful
Thank you for your feedback
Feedback sent
We appreciate your effort and will try to fix the article